Reports built by hand in sheets
Every week someone pulls ads, CRM and accounting into a spreadsheet. Figures diverge, and the report is stale before the meeting.



We bring data from every system into dashboards of the key metrics. A leader sees the picture without manual reports.
Every week someone pulls ads, CRM and accounting into a spreadsheet. Figures diverge, and the report is stale before the meeting.
Marketing, sales and finance calculate the same metrics differently, and meetings turn into arguments about the data.
Dozens of reports, but nobody knows which metrics to watch, and key signals get lost among the secondary ones.
 [ 01 ]free · 30 min
We review the decisions you make and which data is missing for them. You leave with the key metrics. No sales pitch.
 [ 02 ]14 business days
A metrics system, plus an audit of sources and tracking. You get a dashboard plan and a list of data fixes.
 [ 03 ]first 30 days of work
We set up consolidation and automatic refresh, build the dashboards and train the team.
 [ 04 ]ongoing, monthly cycle
We connect new sources, update dashboards for new jobs and watch data quality.
and answers
Data Analytics shows what is happening: metrics, trends and deviations, refreshed on a regular cycle. Data Science looks for causes and builds forecasts: why a metric changed and what comes next. Analytics is a daily management tool. A study answers the hard questions. Analytics is usually set up first.
It depends on your sources and your stack. Looker Studio fits marketing data from Google services and is free to start. Power BI is stronger for complex data models and suits companies on Microsoft products. We justify the choice at the metrics stage.
Because the systems count differently: attribution models, time zones, conversion windows and duplicate events. We fix which source is correct for each metric and explain the gaps in the dashboard notes, so the team stops arguing about the numbers.
Yes. We build them so your team can add filters and simple reports without us. Complex changes to the data model need an understanding of the structure, so we hand over the documentation.
Start with a free 30-minute Clarity Session.
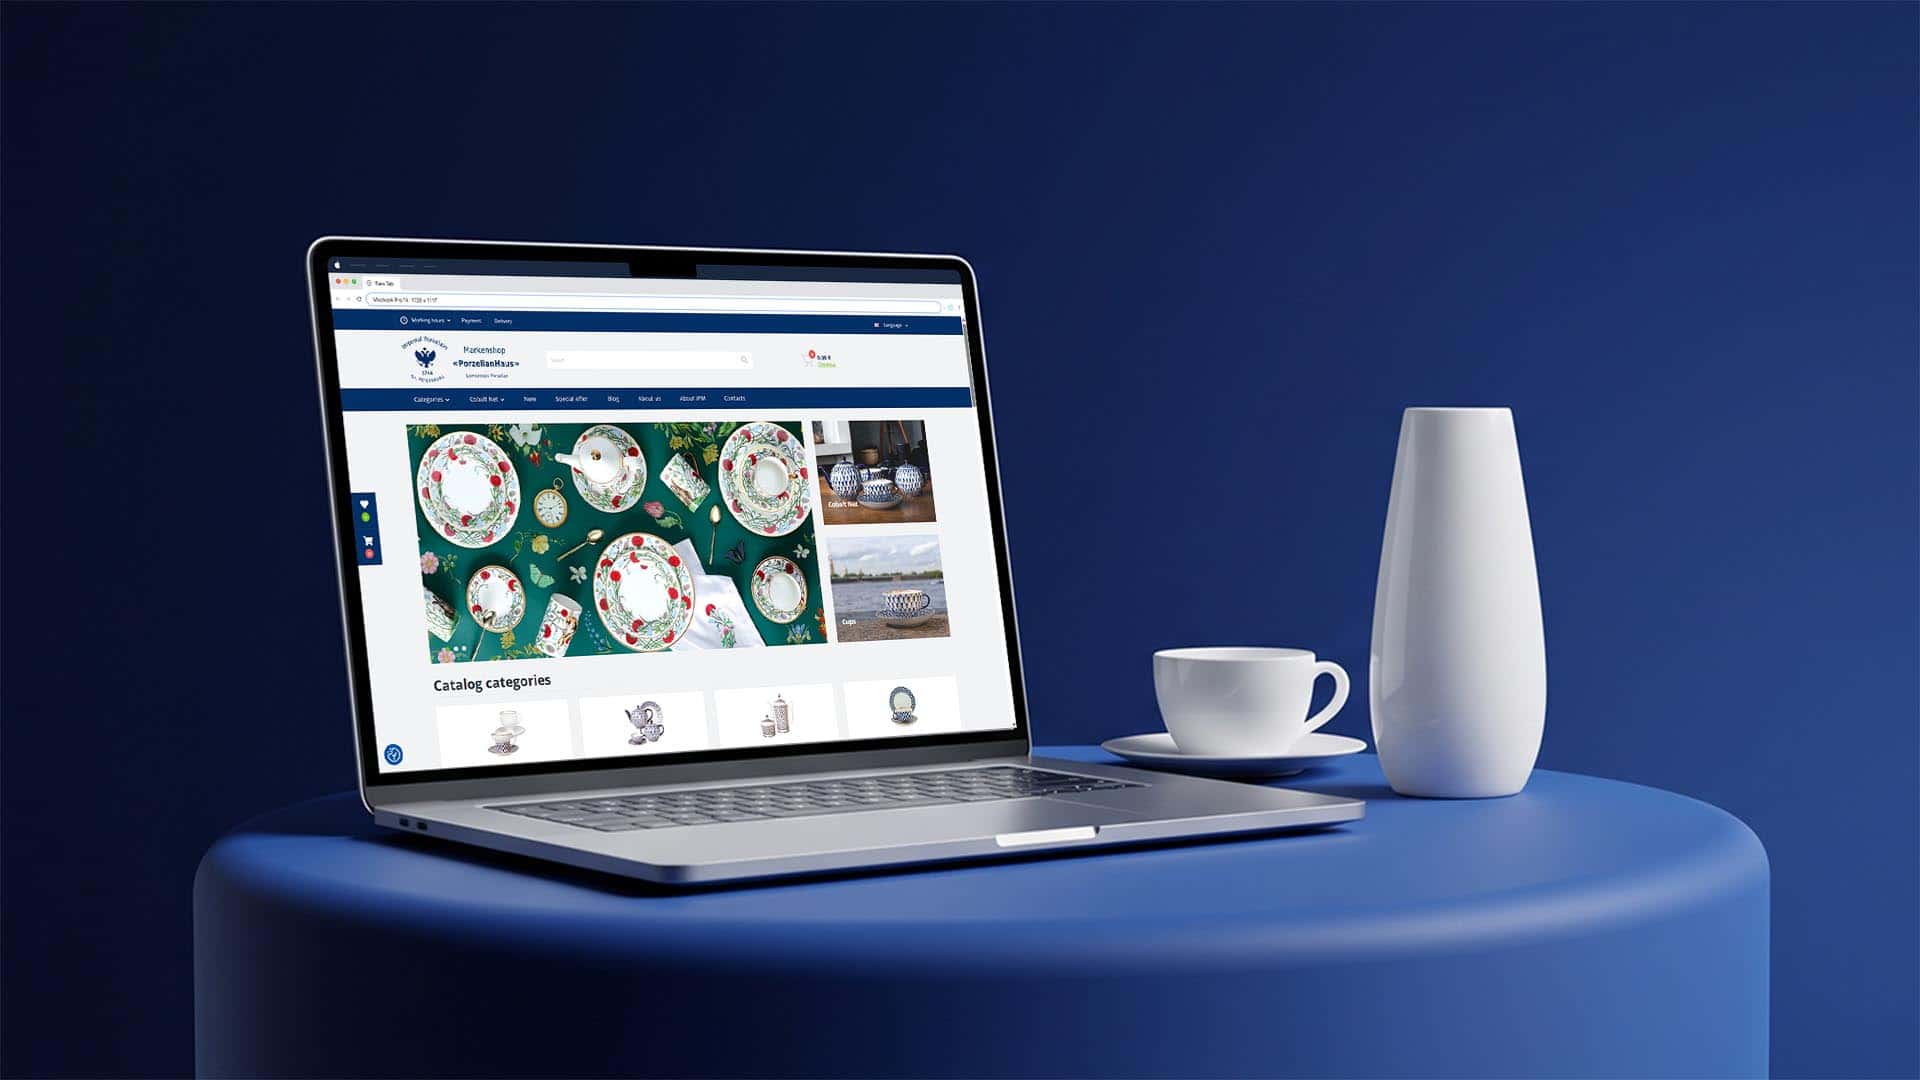 OCTOBER 2026eСommerce / SEO
Google visibility grew by 600% — up to 42 queries in the top 3.
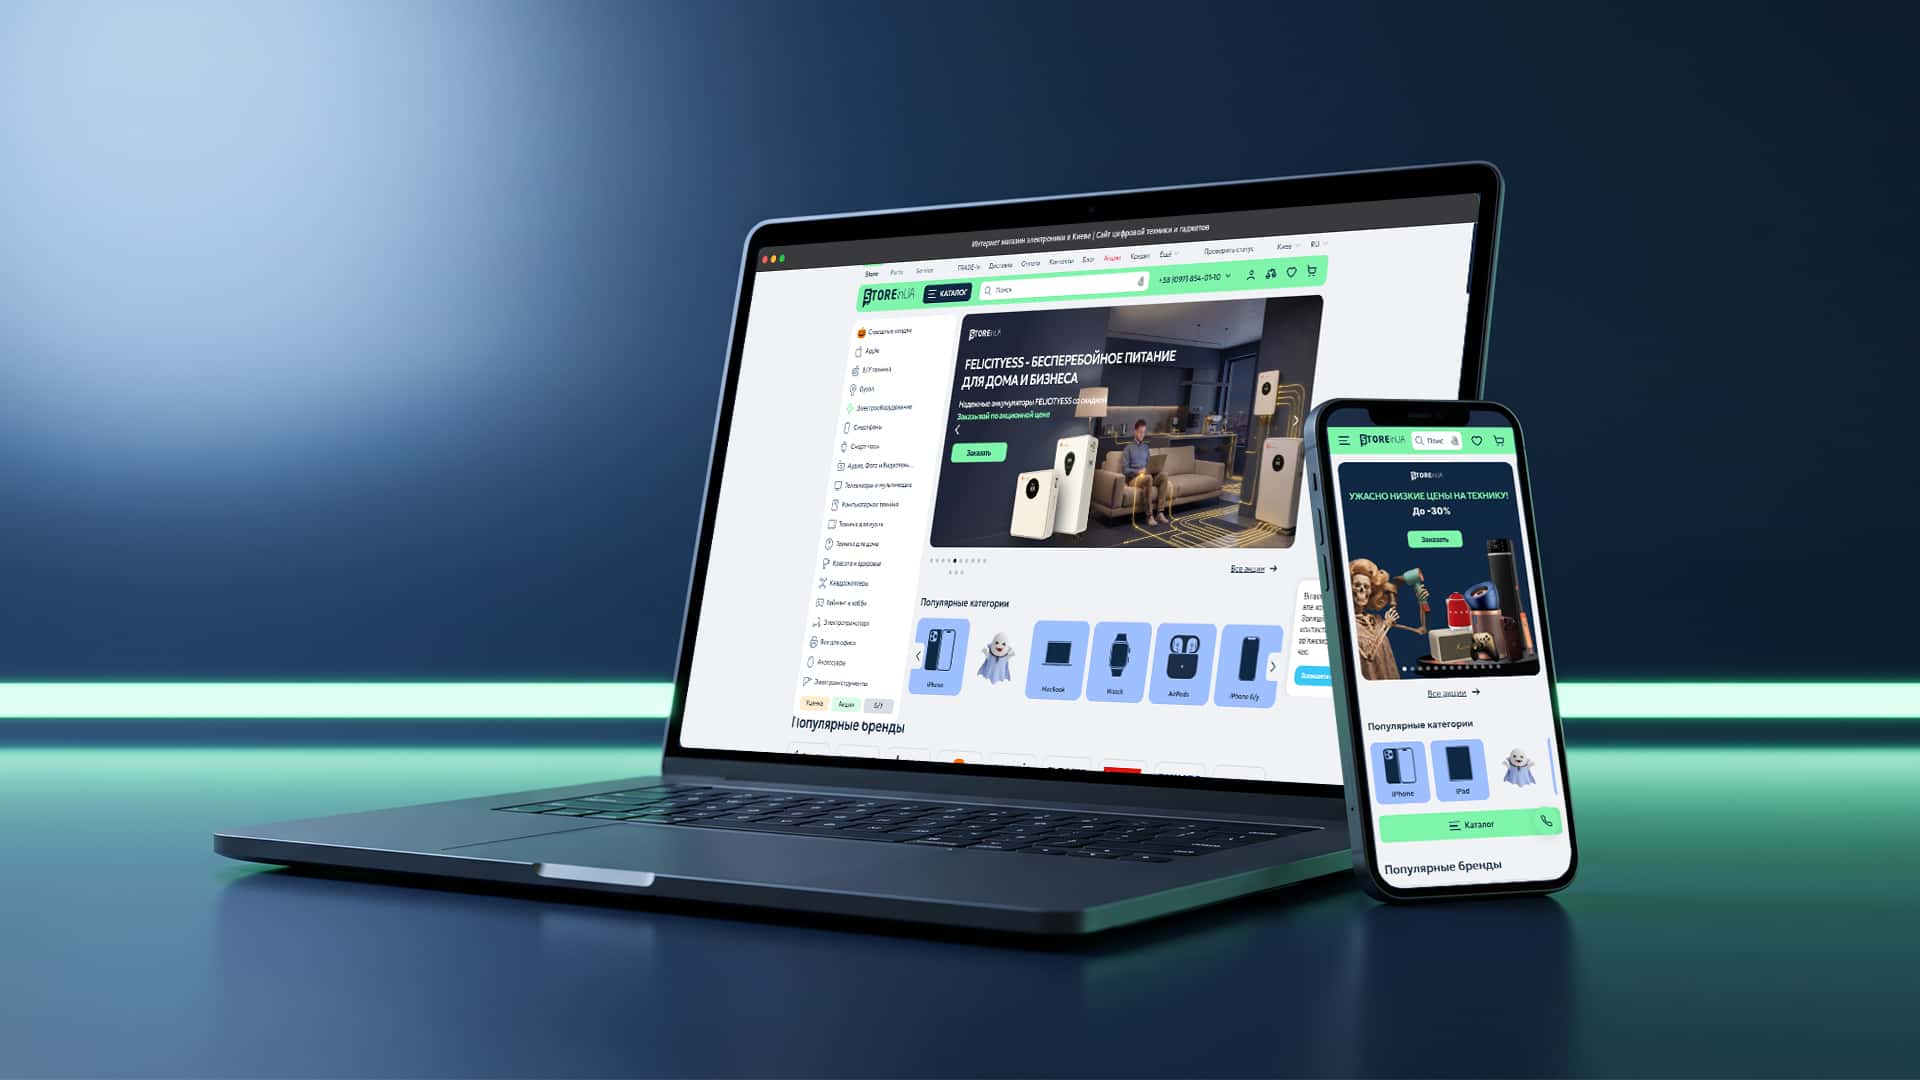 OCTOBER 2026eСommerce / DEVELOPMENT
Purchase conversion up from 1.4% to 3%: a new platform for 1M+ products with no sales stoppage.
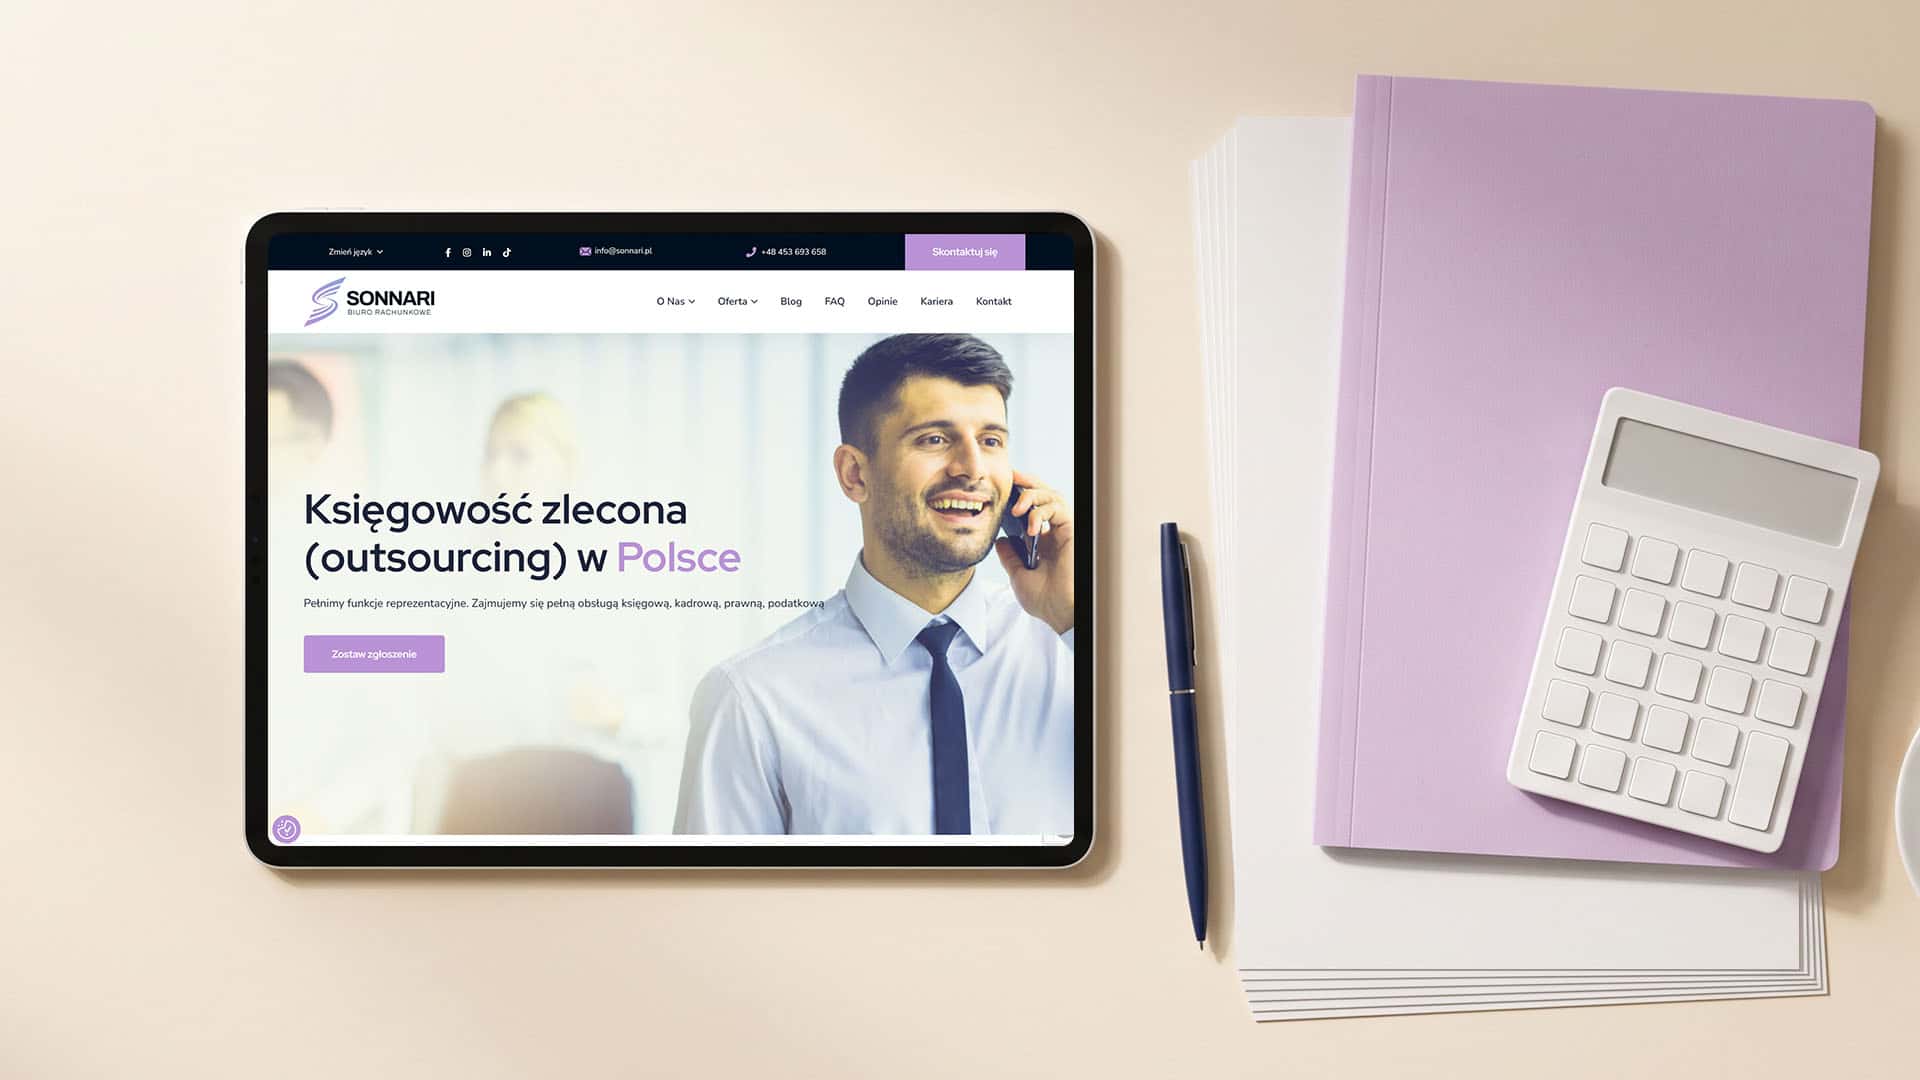 OCTOBER 2026SERVICES / MARKETING
Google visitors grew from 360 to 7000 per month, with 261 queries in the top 10: SEO for accounting in Poland.

Author: GVSPACE

Author: Vasyl Horaichuk

Author: GVSPACE