Own infrastructure
The product runs on its own servers or in Kubernetes, and no one systematically watches their state.

An open-source monitoring system that collects server and app metrics. We choose it when a product runs on its own infrastructure and downtime costs sales.

Without monitoring, a business learns about an outage from customers who could not pay. Prometheus spots signs of overload before the crash and alerts the team right away.
The product runs on its own servers or in Kubernetes, and no one systematically watches their state.
A store, SaaS or booking service loses customers for every minute it is unavailable.
The business wants full monitoring but is not ready to pay a SaaS service per server.
Exporters for CPU, memory, disk and database metrics with load history.
Automatic service discovery and metrics collection from every container.
Custom metrics for orders, payments and errors straight from the product code.
Alertmanager rules with notifications to Slack, Telegram or email.

 OCTOBER 2026eСommerce / DEVELOPMENT
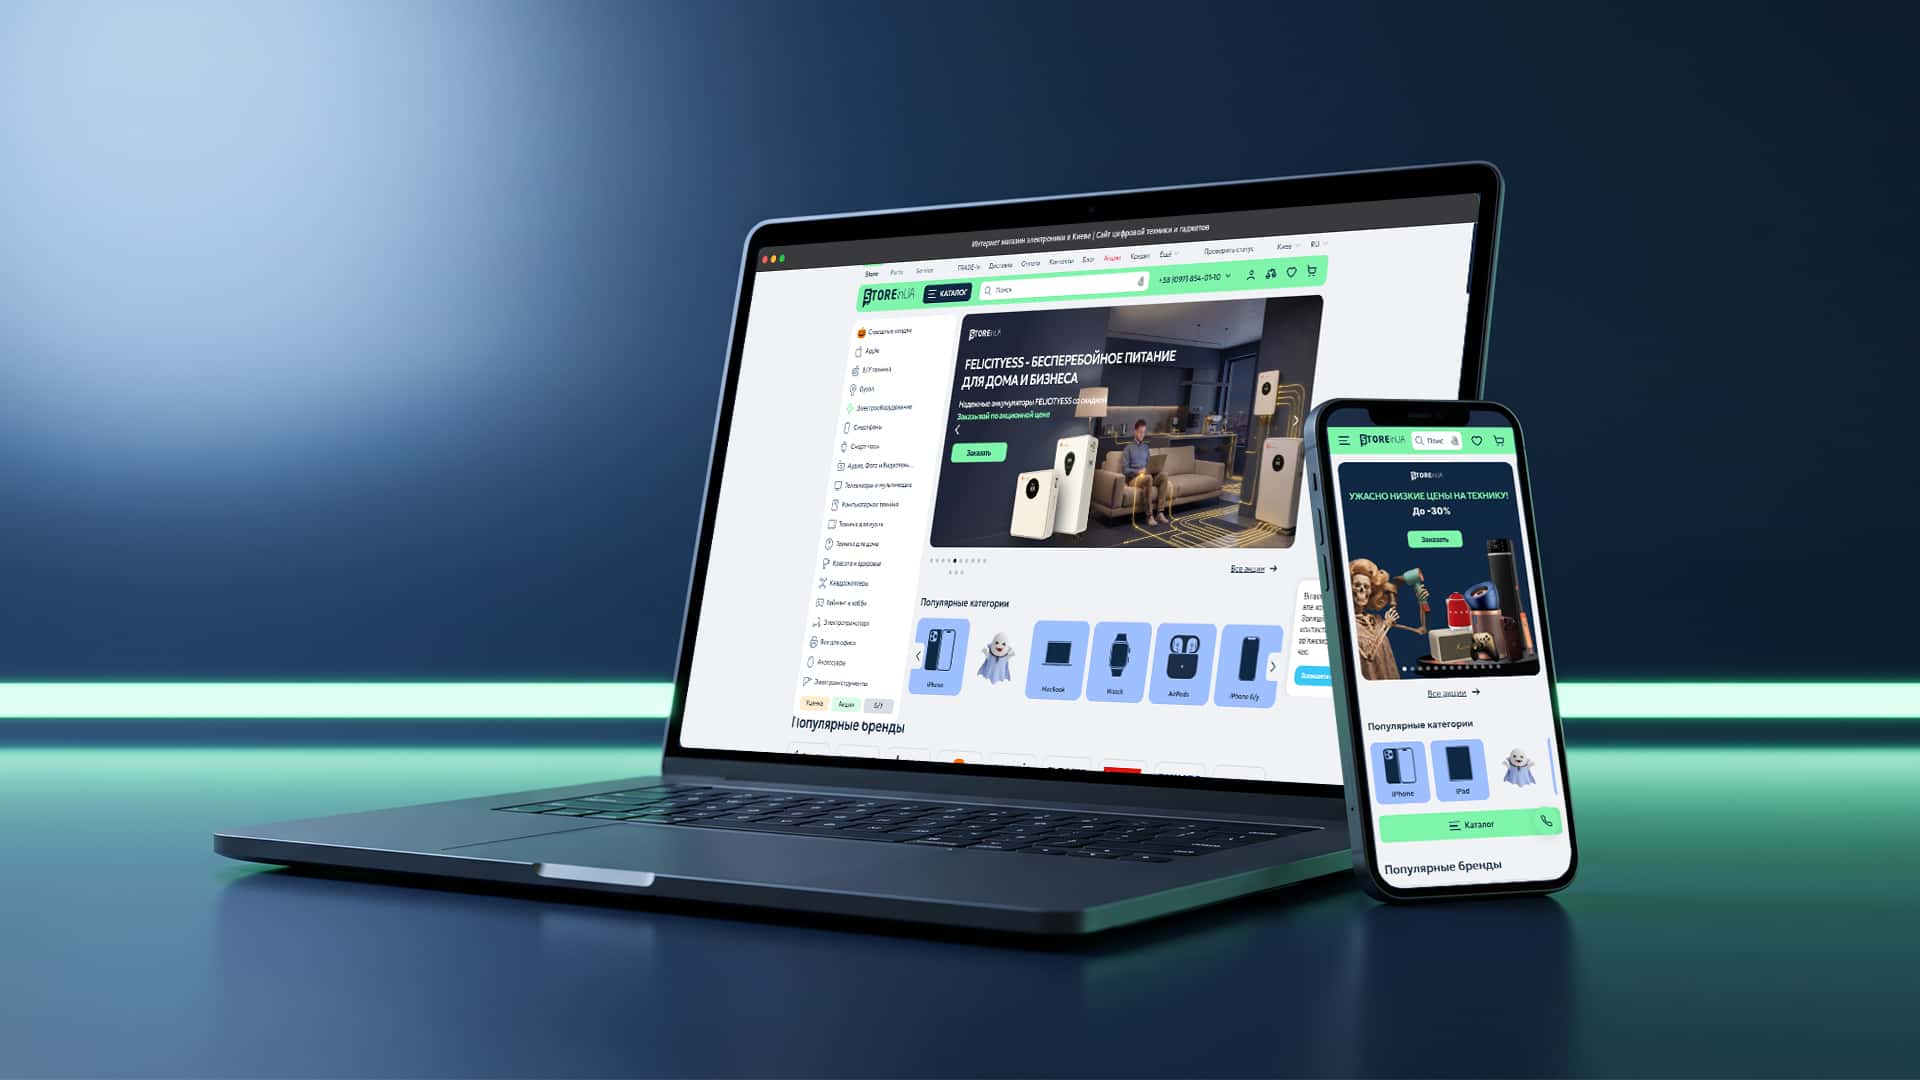
Purchase conversion up from 1.4% to 3%: a new platform for 1M+ products with no sales stoppage.
Book a Clarity Session—a 30-minute review of your marketing. You will receive a map of bottlenecks and a clear understanding of the next steps.

Clarity first. Then — managed and systematic growth.
The team took a professional approach to upgrading site, ensuring high-quality project delivery without interrupting the store’s operations.
 Nikolay LuchinskyRetail Director / STOREinUA
It depends on what downtime costs. For a landing page on managed hosting, a simple uptime check is enough. But if a product on its own servers takes orders or payments, systematic monitoring is needed from day one.
It depends on budget and team. Datadog is faster to launch, but its pricing depends on the number of servers and data volume. Prometheus is free and runs on your infrastructure, so the data stays with you and costs do not grow with every new server.
Yes. We connect Prometheus to Grafana and build separate dashboards: technical ones for the team and simple ones for management, showing availability, errors and key figures such as order count.
At GVSPACE we set up infrastructure monitoring with Prometheus for products on their own servers and in Kubernetes. We collect server, database and application metrics, add business figures such as orders and payment errors, and configure Alertmanager alerts and Grafana dashboards. This way the team sees problems before customers write about them, and management understands the real state of the system.