Downtime costs sales
A store, service or API earns money nonstop, and every minute of failure is a direct loss.

An open platform for visualizing metrics, logs and alerts. We choose it when downtime or slow performance costs money and you need to react before complaints.

Companies often learn their site is down from customers, when sales are already lost. Grafana shows the problem before users notice it, with charts and alerts in your team messenger.
A store, service or API earns money nonstop, and every minute of failure is a direct loss.
Several servers, databases and services whose state cannot be tracked by hand.
The executive wants to see load alongside orders or sign-ups on one screen.
Dashboards for load, memory and disks together with Prometheus.
Response time, errors and API availability with alerts in Slack or Telegram.
Finding the causes of failures through Loki or Elasticsearch in one interface.
Real-time order, sign-up and payment metrics from the product database.

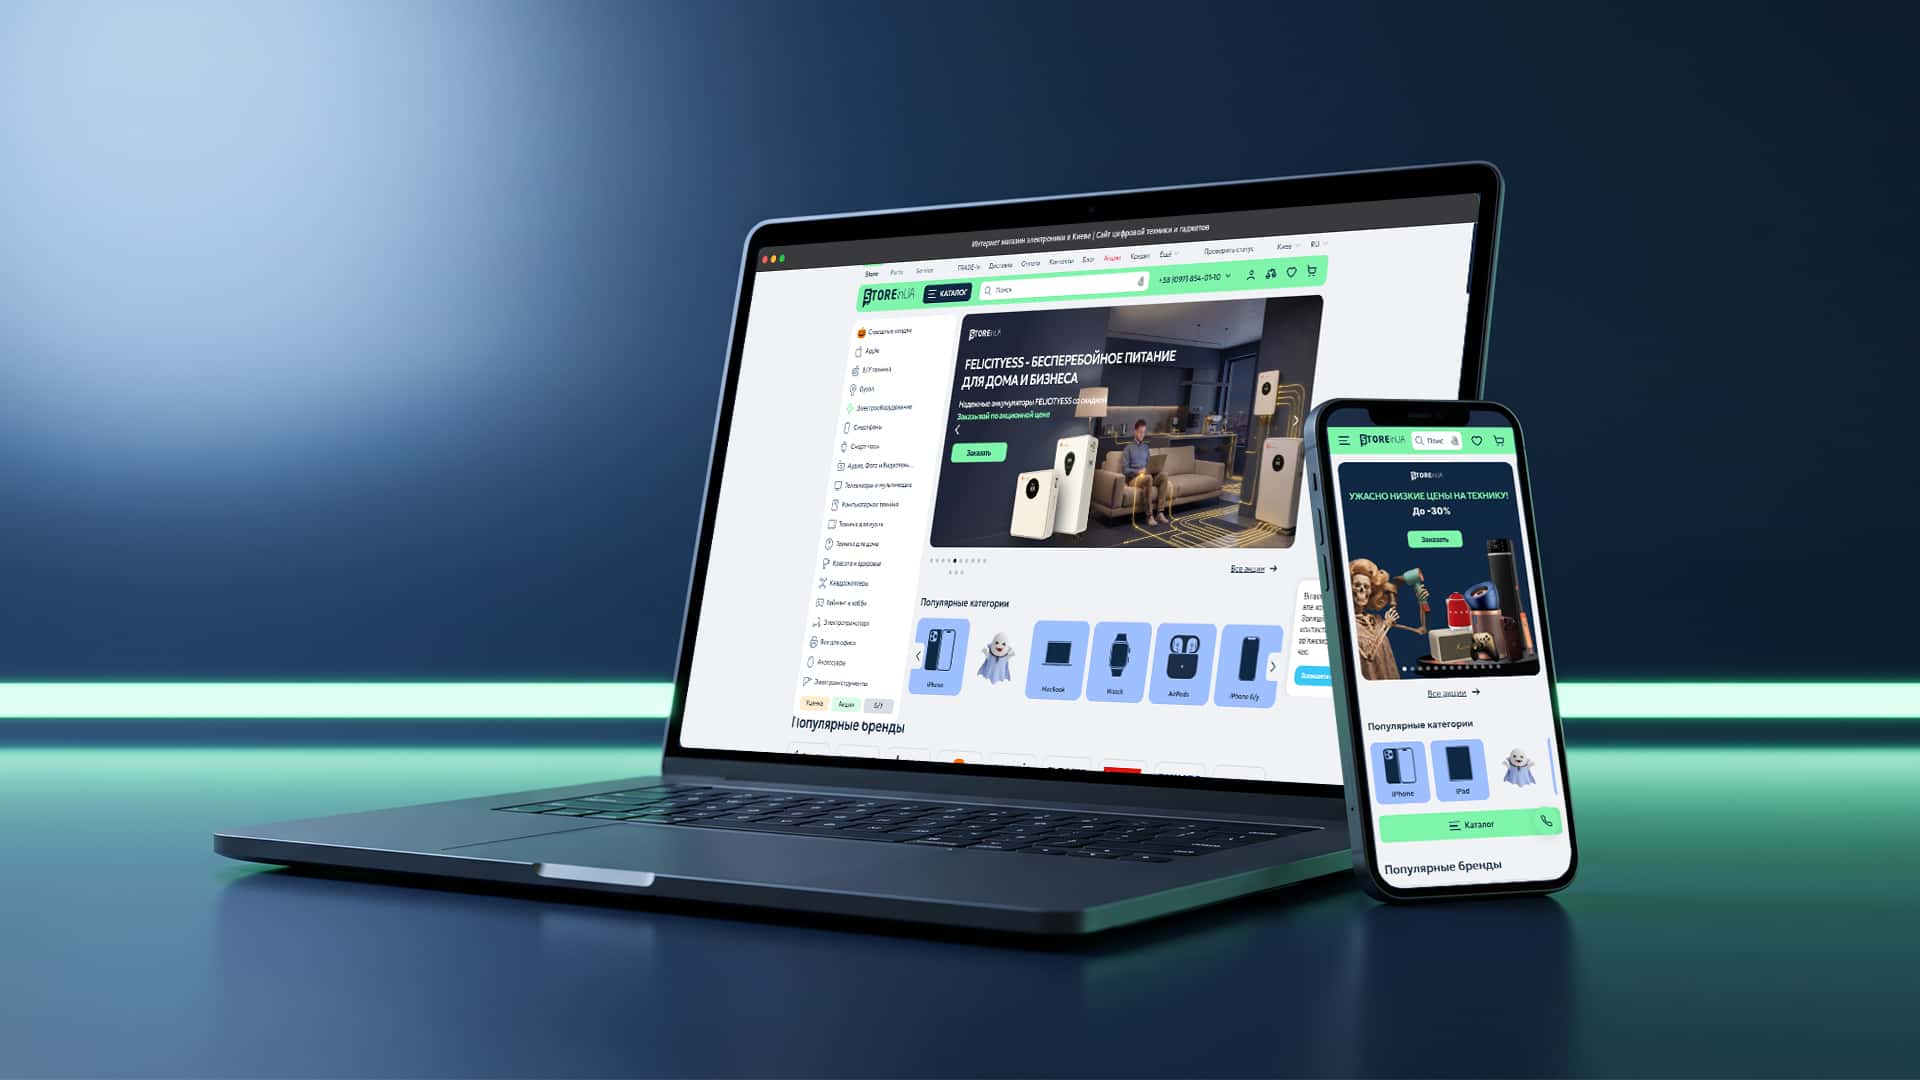 OCTOBER 2026eСommerce / DEVELOPMENT
Purchase conversion up from 1.4% to 3%: a new platform for 1M+ products with no sales stoppage.
Book a Clarity Session—a 30-minute review of your marketing. You will receive a map of bottlenecks and a clear understanding of the next steps.

Clarity first. Then — managed and systematic growth.
The team took a professional approach to upgrading site, ensuring high-quality project delivery without interrupting the store’s operations.
 Nikolay LuchinskyRetail Director / STOREinUA
Yes. Stability without monitoring is a lack of information, not a guarantee. Grafana shows how load changes and warns about problems before they turn into failures.
Yes. Grafana connects to the product databases and shows orders, sign-ups or payments next to technical metrics. That way you see how failures affect revenue.
Hosting monitoring shows only the server's state. Grafana collects data from servers, apps, databases and logs in one place and is tailored to your metrics. It is open source, so it does not tie you to a specific provider.
GVSPACE sets up Grafana monitoring for products where downtime directly costs money: online stores, SaaS services, APIs and mobile backends. We connect server, app and database metrics, logs and business indicators, and set up alerts in team messengers. As a result, the team sees a problem before customers do, and the executive gets a clear picture of the product's state.